I want to write this topic a few years back, but never have had the chance to write a blog about it. When I had time to write the topic, I don’t have the access to the real case. When I have the access to the real case, I was busy in taking care of other stuffs. Finally, I have time and real case to discuss this topic and this is the main purpose for this post.
There are tons of articles and blogs discussing Direct Path Read and Buffer Cache Read and I am not going to repeat their findings. The good ones are Tanel‘s Optimizer statistics-driven direct path read decision for full table scans, Alex Fatkulin‘s 11G adaptive direct path reads — what is the cached/dirty blocks threshold?, Doug Burn‘s 11g and direct path reads and Frits Hoogland‘s Investigating the full table direct path / buffered decision. These are very good articles and have many test cases you can play with in your environment. This post discusses the processes and steps I use to analyze the performance issue related to Direct Path Read from a production environment.
At the time when we look at a query’s execution plan, if seeing TABLE ACCESS FULL, there are only two ways to go to perform full table scan:
1. Conventional path read or buffer cache read
2. Direct path read
For direct path read, SGA is bypassed and the blocks are read directly into PGA. Direct path read is faster than scattered reads because it can avoid latches. But on the other hand, oracle needs to count the total number of dirty blocks in the memory for each table/segment or go though the checkpoint queue to count the buffers. The checkpoint is done for the segment to make all the blocks of the segment up-to-date. You could see enq: KO – fast object checkpoint event just before the direct path read.
The performance issue related Direct Path Read is from a small 12c production database with only 4GB SGA and buffer cache is about 2.5 GB. This query is pretty simple, just doing full table scan.
1
2
3
4
5
6
7
8
9
10
11
12
| SQL_ID fqf3hk93j5k4n, child number 0-------------------------------------SELECT CLIENT_ID,STATUS,SHP_ID FROM INV_APP_NRD.SAL_SHIPWSWHERE CLIENT_ID = :1Plan hash value: 2885481213--------------------------------------------------------------------------------| Id | Operation | Name | Rows | Bytes | Cost (%CPU)| Time |--------------------------------------------------------------------------------| 0 | SELECT STATEMENT | | | | 3035 (100)| ||* 1 | TABLE ACCESS FULL| SAL_SHIPWS | 1 | 30 | 3035 (1)| 00:00:01 |-------------------------------------------------------------------------------- |
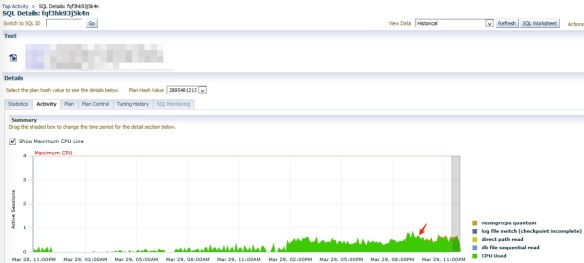
Although the query can complete within half second, the total number of executions make it always top 5 queries in the database. I made a recommendation to add an index before this incident happened, but the recommendation has never been approved and implemented in the production. Before the issue happened, the query is mainly on CPU, see the screenshot below. When the issue happened, it shows significant Direct Path Read event. To find out why there was sudden change in the query performance, I did some analysis to investigate why it happened.
Before the issue happened

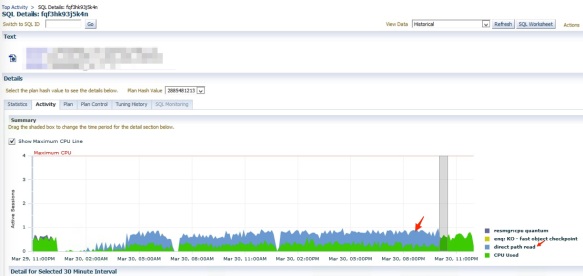
After the issue happened

As always, I run awr_plan_change.sql first and get the following result:
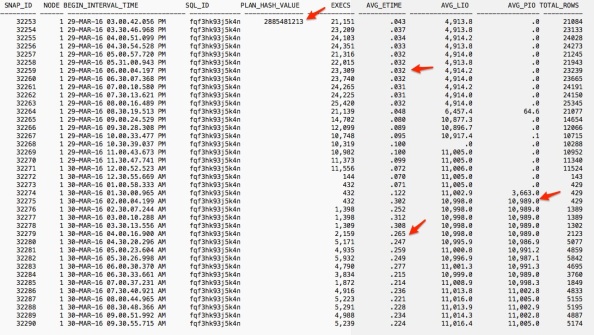

The result shows the following:
1. The query is still using the same plan with the same hash value. So I can rule out the possibility that performance was caused by a plan change.
1. The query is still using the same plan with the same hash value. So I can rule out the possibility that performance was caused by a plan change.
2. The average LIO is roughly no change with about 4,900 before 8:30pm on Mar. 29. Then suddenly shot up 6,457 half hour latter. Then to 11,000 for the rest of day and Mar. 30. The performance issue happened around 2am Mar. 30 when almost same physical IO (PIO) as LIO happened. I can see the average run time shot up from 0.032 to about 0.23, about 8~10 times slower than before.
I know this sudden change to direct path read is very likely caused by _small_table_threshold. _small_table_threshold is a hidden parameter that defines the number of blocks to consider a table as being small. You can use the following query to find out this value.
1
2
3
4
| select ksppstvlfrom x$ksppi x, x$ksppcv ywhere (x.indx = y.indx)and ksppinm='_small_table_threshold'; |
Unfortunately I don’t have the access to the X$ tables. So I use another way: 2% of buffer cache. I have verified this number in the past and my tests shows value of _small_table_threshold is somewhere between 1.84%~2% of buffer cache. For small table, full table scan always read into buffer cache. If size of the table or segment > 5*_small_table_threshold or 10% of buffer cache, then the table/segment is considered Large table and always uses Direct Path Read. For table between small and large table, it is Medium size table, i.e, between 2% and 10% of buffer cache. For Medium size table, sometimes it uses Direct Path Read and sometime it uses Buffer Cache Read. One popular opinion is when 50+% of table blocks are in buffer cache or dirty, the full scan uses buffer cache read while direct path read covers the rest of scenario. Frits’ article discussed his tests on 12c database and said for medium size table, 50% dirty rule still hold true for buffer cache read, but at least 99% of blocks in buffer cache can make full table scan use Buffer Cache Read instead of Direct Path Read. For majority of cases, it’s unlikely to have 50% blocks in a segment changed in a short time. It’s also unlikely to have almost all blocks (99+%) in the buffer cache for a busy database. So if Frits’ opinion is correct, we will likely to see Direct Path Read for a full table scan once the table/segment size exceeds _small_table_threshold.
The value of _small_table_threshold is in block counts. The block count is taken from statistics in the data dictionary. But optimizer does not make the decision for direct path read, it is a run time decision done during every execution. Parallel queries are always using direct path read. For non-parallel queries, the change of current buffer cache size or the number of blocks in the cache will have the impact in the decision to go with direct path read or buffer cache read. If you feel RDBMS does not make correct decision to use direct path read, you may try _serial_direct_read parameter at session level, which I would not recommend doing so.
To understand more, let’s look at the few moving parts related to this issue:
Dirty Blocks
Ideally I would use X$BH to find out the number of dirty blocks. Unfortunately I don’t have the access to X$BH. Instead I check out dba_tab_modifications to get rough estimation whether there are many changes in the table.
Dirty Blocks
Ideally I would use X$BH to find out the number of dirty blocks. Unfortunately I don’t have the access to X$BH. Instead I check out dba_tab_modifications to get rough estimation whether there are many changes in the table.
1
2
3
4
5
6
7
8
9
10
11
12
13
14
15
16
17
18
19
20
21
22
23
24
25
26
| col table_name for a30col table_owner for a20select * from ( select m.table_owner , m.table_name , t.last_analyzed , m.inserts , m.updates , m.deletes , t.num_rows , ( m.inserts + m.updates + m.deletes )*100 / case when t.num_rows is null or t.num_rows = 0 then 1 else t.num_rows end "Change Factor%" from dba_tab_modifications m , dba_tables t where t.owner = m.table_owner and t.table_name = m.table_name and m.inserts + m.updates + m.deletes > 1 and m.table_owner='INV_APP' and m.table_name like 'SAL_SHIPWS' order by "Change Factor%" desc );TABLE_OWNER TABLE_NAME LAST_ANALYZED INSERTS UPDATES DELETES NUM_ROWS Change Factor----------- ---------- ------------- ------- ------- ------- -------- -------------INV_APP SAL_SHIPWS 29-MAR-16 10687 11359 0 1897664 1.1617441 |
There is only 1.16% of rows get modified since last analyzed time one night before, far below the 50% dirty threshold. So I can rule out the possibility from dirty blocks.
The Buffer Cache Size
I run the following query to show the size of buffer cache and 2%of buffer cache in MB and blocks.
I run the following query to show the size of buffer cache and 2%of buffer cache in MB and blocks.
1
2
3
4
5
6
7
8
9
10
11
12
13
14
15
| col component for a25col size_MB for 999,999col stth head "Small Table|Threshold in Blks" for 99,999,999col stth_size head "Small Table|Threshold|in MB" for 999,999select component, current_size/(1024*1024) size_MB, current_size/8192 * 0.02 stth,current_size/(1024*1024) * 0.02 stth_sizefrom v$sga_dynamic_componentswherecomponent like 'DEFAULT buffer cache%'; Small Table Small Table ThresholdCOMPONENT SIZE_MB Threshold in Blks in MB--------------------- -------- ----------------- -----------DEFAULT buffer cache 2,496 6,390 50 |
We can see the 6,390 blocks is the magic number that will decide whether the table is a small table or not.
Table size
Remember the decision related to use direct path read is not based on the current size of table, but the value at the time when last stats was captured. So I run the following the query to get the latest stat info related to the table.
Remember the decision related to use direct path read is not based on the current size of table, but the value at the time when last stats was captured. So I run the following the query to get the latest stat info related to the table.
1
2
3
4
5
6
7
8
9
10
11
12
13
14
| col owner for a20col table_name for a25col last_analyzed for a20select owner, table_name, object_type, to_char(last_analyzed, 'yyyy-mm-dd hh24:mi:ss') last_analyzed, blocks, num_rows, sample_size samplefrom dba_tab_statisticswhereowner ='INV_APP'and table_name ='SAL_SHIPWS'; OWNER TABLE_NAME OBJECT_TYPE LAST_ANALYZED BLOCKS NUM_ROWS SAMPLE ------- ---------- ----------- ------------------- ------- -------- -------INV_APP SAL_SHIPWS TABLE 2016-03-29 22:00:34 11131 1897664 1897664 |
Ok, 11131 blocks is greater than the small table threshold of 6390 blocks. So the table size is definitely the factor triggering the direct path read. Then my next question is that why this thing happens right now, but never in the past. It might be considered as small table in the past. Run the following query to check out the stats history for the table.
1
2
3
4
5
6
7
8
9
10
11
12
13
14
15
16
17
18
19
20
21
22
23
24
25
26
27
28
| col owner for a12col object_name for a25col object_type for a15col subobject_name for a25col obj# for 999999col save_time for a20col analyze_time for a20select o.owner, o.object_name, o.subobject_name, th.obj#, o.object_type,to_char(analyzetime, 'yyyy-mm-dd hh24:mi:ss') analyze_time,rowcnt, blkcnt, avgrln, samplesize, samplesize, to_char(savtime, 'yyyy-mm-dd hh24:mi:ss') save_timefrom sys.WRI$_OPTSTAT_TAB_HISTORY th,dba_objects owhereo.object_id = th.obj#and o.owner = 'INV_APP'and o.object_name = 'SAL_SHIPWS'order by th.analyzetime desc;OWNER OBJECT_NAME OBJ# OBJECT_TYPE ANALYZE_TIME ROWCNT BLKCNT AVGRLN SAMPLESIZE SAMPLESIZE SAVE_TIME------- ----------- ------ ----------- ------------------- ------- ------ ------ ---------- ---------- ------------------- INV_APP SAL_SHIPWS 146907 TABLE 2016-03-25 22:02:20 831675 4668 47 831675 831675 2016-03-29 22:00:35INV_APP SAL_SHIPWS 146907 TABLE 2016-03-16 22:02:08 798969 4542 47 798969 798969 2016-03-25 22:02:20INV_APP SAL_SHIPWS 146907 TABLE 2016-03-08 22:00:42 770679 4416 47 770679 770679 2016-03-16 22:02:08INV_APP SAL_SHIPWS 146907 TABLE 2016-02-29 22:02:05 343578 2022 47 343578 343578 2016-03-08 22:00:42INV_APP SAL_SHIPWS 146907 TABLE 2016-02-18 22:01:34 346437 2022 47 346437 346437 2016-02-29 22:02:05INV_APP SAL_SHIPWS 146907 TABLE 2016-02-05 22:01:21 335163 1896 47 335163 335163 2016-02-18 22:01:34INV_APP SAL_SHIPWS 146907 TABLE 2016-01-20 22:09:22 323044 1896 47 323044 323044 2016-02-05 22:01:21 |
The result clearly shows all of the block counts are less than 6390 and the table was always considered as small table in the past.
Wait Event
The above queries and results show the direct path read is very likely outcome. Then I need to prove the wait event is indeed related to direct path read. Run the following query:
The above queries and results show the direct path read is very likely outcome. Then I need to prove the wait event is indeed related to direct path read. Run the following query:
1
2
3
4
5
6
7
8
9
10
11
12
13
14
15
16
17
18
19
20
21
22
23
24
25
26
27
28
29
30
31
32
33
34
35
36
37
38
39
40
41
42
43
44
45
46
47
48
49
50
51
52
53
54
55
56
57
58
59
60
61
62
63
64
65
66
67
68
69
| col session for a20col wait_class for a20col event for a40col total for 999,999col read_io_mb for 999,999.9select sql_id, sql_plan_hash_value hash_val, to_char(sample_time, 'yyyy-mm-dd hh24') sample_time, session_state, wait_class, event, count(*) total, sum(delta_read_io_bytes)/(1024*1024) read_io_mbfrom DBA_HIST_ACTIVE_SESS_HISTORY wheresql_id='fqf3hk93j5k4n'and sample_time > sysdate - 2group by sql_id, sql_plan_hash_value,to_char(sample_time, 'yyyy-mm-dd hh24'), session_state, wait_class, eventorder by sample_time;SQL_ID SAMPLE_TIME SESSION WAIT_CLASS EVENT TOTAL READ_IO_MB------------- ------------- ------- ------------- ---------------------------------------- -------- ----------fqf3hk93j5k4n 2016-03-29 14 ON CPU 37 134.7fqf3hk93j5k4n 2016-03-29 15 ON CPU 172 154.0fqf3hk93j5k4n 2016-03-29 16 ON CPU 162 .5fqf3hk93j5k4n 2016-03-29 17 ON CPU 138 5.2fqf3hk93j5k4n 2016-03-29 18 ON CPU 152 134.8fqf3hk93j5k4n 2016-03-29 19 ON CPU 138 1,629.9fqf3hk93j5k4n 2016-03-29 20 ON CPU 183 9,953.9fqf3hk93j5k4n 2016-03-29 20 WAITING Configuration log file switch (checkpoint incomplete) 1 7.1fqf3hk93j5k4n 2016-03-29 20 WAITING User I/O direct path read 2 1,519.9fqf3hk93j5k4n 2016-03-29 21 ON CPU 229 335.8fqf3hk93j5k4n 2016-03-29 22 ON CPU 179 552.1fqf3hk93j5k4n 2016-03-29 22 WAITING Scheduler resmgr:cpu quantum 17 2.6fqf3hk93j5k4n 2016-03-29 22 WAITING User I/O db file sequential read 1 .7fqf3hk93j5k4n 2016-03-29 23 ON CPU 190 670.0fqf3hk93j5k4n 2016-03-29 23 WAITING Scheduler resmgr:cpu quantum 26fqf3hk93j5k4n 2016-03-30 00 ON CPU 76 188.8fqf3hk93j5k4n 2016-03-30 00 WAITING Scheduler resmgr:cpu quantum 2fqf3hk93j5k4n 2016-03-30 01 ON CPU 4 269.4fqf3hk93j5k4n 2016-03-30 01 WAITING User I/O direct path read 2 3,992.1fqf3hk93j5k4n 2016-03-30 02 ON CPU 15 43,887.2fqf3hk93j5k4n 2016-03-30 02 WAITING User I/O direct path read 33 107,623.2fqf3hk93j5k4n 2016-03-30 03 ON CPU 25 101,191.1fqf3hk93j5k4n 2016-03-30 03 WAITING User I/O direct path read 50 127,974.5fqf3hk93j5k4n 2016-03-30 04 ON CPU 74 252,514.8fqf3hk93j5k4n 2016-03-30 04 WAITING User I/O direct path read 117 326,216.4fqf3hk93j5k4n 2016-03-30 05 ON CPU 100 351,210.6fqf3hk93j5k4n 2016-03-30 05 WAITING Application enq: KO - fast object checkpoint 1 1,315.1fqf3hk93j5k4n 2016-03-30 05 WAITING User I/O direct path read 173 502,828.0fqf3hk93j5k4n 2016-03-30 06 ON CPU 63 195,762.7fqf3hk93j5k4n 2016-03-30 06 WAITING Application enq: KO - fast object checkpoint 1 985.5fqf3hk93j5k4n 2016-03-30 06 WAITING User I/O direct path read 159 491,567.9fqf3hk93j5k4n 2016-03-30 07 ON CPU 79 243,513.4fqf3hk93j5k4n 2016-03-30 07 WAITING User I/O direct path read 75 271,548.4fqf3hk93j5k4n 2016-03-30 08 ON CPU 91 316,045.2fqf3hk93j5k4n 2016-03-30 08 WAITING User I/O direct path read 137 498,446.2fqf3hk93j5k4n 2016-03-30 09 ON CPU 79 329,797.0fqf3hk93j5k4n 2016-03-30 09 WAITING User I/O direct path read 141 497,647.9. . . .fqf3hk93j5k4n 2016-03-30 20 ON CPU 81 221,629.5fqf3hk93j5k4n 2016-03-30 20 WAITING User I/O direct path read 215 608,258.5fqf3hk93j5k4n 2016-03-30 21 ON CPU 81 275,751.3fqf3hk93j5k4n 2016-03-30 21 WAITING User I/O direct path read 202 589,110.1fqf3hk93j5k4n 2016-03-30 22 ON CPU 193 6,965.6fqf3hk93j5k4n 2016-03-30 22 WAITING User I/O direct path read 30 25,242.7fqf3hk93j5k4n 2016-03-30 23 ON CPU 245 137.6fqf3hk93j5k4n 2016-03-31 00 ON CPU 89 538.7fqf3hk93j5k4n 2016-03-31 01 ON CPU 11 1,213.2fqf3hk93j5k4n 2016-03-31 02 ON CPU 11 16,901.3fqf3hk93j5k4n 2016-03-31 02 WAITING User I/O direct path read 33 83,902.7fqf3hk93j5k4n 2016-03-31 03 ON CPU 23 47,317.6fqf3hk93j5k4n 2016-03-31 03 WAITING User I/O direct path read 79 177,203.5fqf3hk93j5k4n 2016-03-31 04 ON CPU 59 144,902.3fqf3hk93j5k4n 2016-03-31 04 WAITING User I/O direct path read 161 438,593.4fqf3hk93j5k4n 2016-03-31 05 ON CPU 93 279,670.5 |
The above result indeed shows the wait event pattern change. From purely ON CPU to direct path read
Am I done with the analysis? Not yet. If you look at the above result carefully, you will notice the pattern change to “ON CPU” again between 22:30 and 2am next day. I verified the table size did not change and the table is still considered Medium size table. It becomes more interesting. Then I observed the same behavior during the same timeframe the next day. At this moment, I know it could relate to Oracle’s AUTO Jobs, which are running during the same timeframe. Yes, I indeed found some SQLs from SQL Analyzer with the query like this /* SQL Analyze(2722,1) */ SELECT CLIENT_ID,STATUS,SHP_ID FROM INV_APP_NRD.SAL_SHIPWS WHERE CLIENT_ID = :1. I guess this SQL analyzer loads all blocks from this table into buffer cache. It forces the run time decision to use buffer read instead of direct path read. After 2am when some blocks are flushed out of buffer cache and total number of blocks of this table is below certain threshold, maybe 99% as Frits pointed out, then the run time decision would favor direct path read.
Solutions
Ok at this moment, I am done with the analysis and it is pretty much matching what I thought originally. The next question everyone would ask what I can do with it. If you don’t want to direct path for your queries, there are a few options:
Ok at this moment, I am done with the analysis and it is pretty much matching what I thought originally. The next question everyone would ask what I can do with it. If you don’t want to direct path for your queries, there are a few options:
Tune the SQL
For very large table, if queries do the full scan of the table less frequently, say, once a week, there is no point to place these blocks in the buffer cache and you want to use Direct Path Read. For full scan of tables no matter whether large or small, if happens very frequently, then the large number of executions of the query using Direct Path Read will make the SQLs expensive. One way to check the cardinality of the predicate in the query and add an index if necessary. Actually this is the top recommendation I made for this query. Adding a new index on CLIENT_ID will scan only less than 50 rows instead of 1.9 million rows.
For very large table, if queries do the full scan of the table less frequently, say, once a week, there is no point to place these blocks in the buffer cache and you want to use Direct Path Read. For full scan of tables no matter whether large or small, if happens very frequently, then the large number of executions of the query using Direct Path Read will make the SQLs expensive. One way to check the cardinality of the predicate in the query and add an index if necessary. Actually this is the top recommendation I made for this query. Adding a new index on CLIENT_ID will scan only less than 50 rows instead of 1.9 million rows.
Increase SGA size
In case you can not tune the query, increasing SGA size will be your next option. If increase SGA size, the db cache size will increase. It means the increase of the value of _small_table_threshold. This is another common solution.
In case you can not tune the query, increasing SGA size will be your next option. If increase SGA size, the db cache size will increase. It means the increase of the value of _small_table_threshold. This is another common solution.
Change _small_table_threshold
You could change the value of _small_table_threshold parameter. But I don’t think this is a good idea to touch this parameter.
You could change the value of _small_table_threshold parameter. But I don’t think this is a good idea to touch this parameter.
Cache the table
This is an interesting solution I have never used or tested before. But theoretically it should work: using ALTER TABLE tableName CACHE. Please note, it does not mean storing all blocks from the table in the buffer cache, but just tell Oracle to handle the blocks differently when they get into the cache. In other words, the table would be ALWAYS treated as small table regardless of the actual size of the table.
When you create or alter a table, you have 3 options: CACHE, or NOCACHE, or CACHE READS.
NOCACHE is the default value and this is what everyone uses for the majority of tables. When oracle is doing a full scan of a table/segment, it places the blocks onto the least recently end of Least Recently Used (LRU) list in the buffer cache. So it makes these blocks more prone to being aged out of the buffer cache. So for some data that is accessed frequently, CACHE allows you to place the blocks of the tables at the other side of the list, the most recently used end of LRU list, when a full table scan is performed.
CACHE READS applies only to LOB storage. It’s useful when you want to bring LOB values into the buffer cache only during read, not during write operations. By the way, when creating table with LOB column, you could specify CACHE option in the LOB_storage_clause to places LOB data values in the buffer cache for faster access. By the default, both BasicFiles and SecureFiles LOBs is doing NOCACHE LOGGING. The downside of caching LOBs is when not using carefully, the flooding of cache of LOB object would force rest of database data out of buffer cache and have more Disk Read rather than cache hits for non-LOB data. This is uncommon behavior and SGA increase could improve the performance from this issue.
No comments:
Post a Comment