Understanding Linux top command results. As a Linux system administrator, the top command is a frequently used command and our daily tasks we used multiple times this commands to view resource utilization by processes on the server. This command helps us to find which process is utilizing what resources of the system.
- Sysstat – Linux System Performance Monitoring Tool
- Glances – A Real-Time Linux System Monitoring Tool
Using this article, I am trying to write to how to use to command and understand the results of top command on the Linux system
How to Read Linux Top Command Output
When you execute the top command on Linux, it shows a lot of results, here I am trying to show you to how to read it row by row.
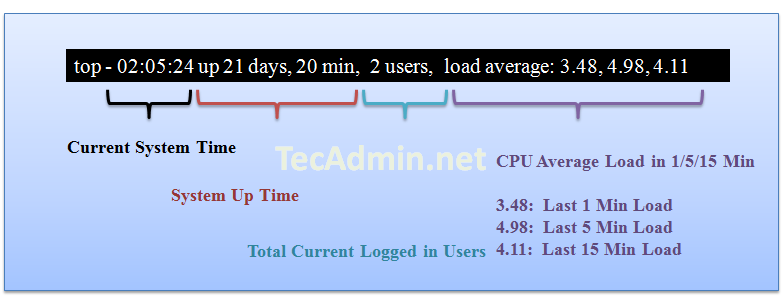
Result Row #1
Row 1 results show about server uptime from the last reboot, currently logged in users and CPU load on the server. The same output you can find using Linux uptime command.
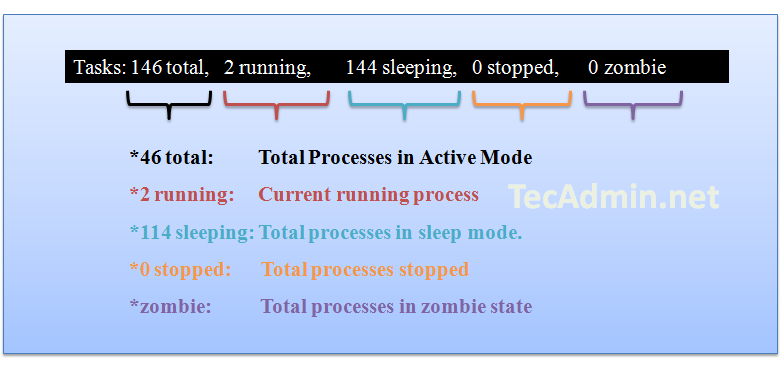
Result Row #2
Row 2 shows the number of process running on the server and their state.
Result Row #3
Row three shows the CPU utilization status on the server, you can find here how much CPU is free and how much is utilizing by the system.
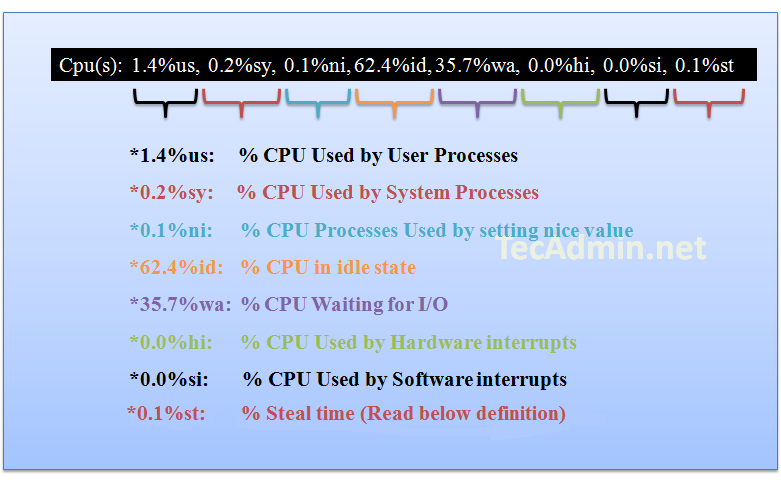
Steal time is the time that a virtual CPU waits for a real CPU while the hypervisor is servicing another virtual processor.
Definition from access.redhat.com
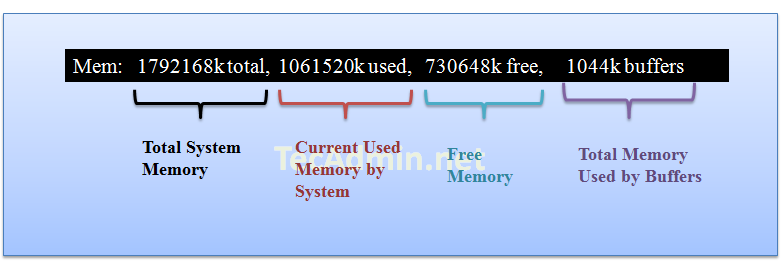
Result Row #4
Row 4 shows the memory utilization on the server, you can find here how much memory is used, the same results you can find using free command.
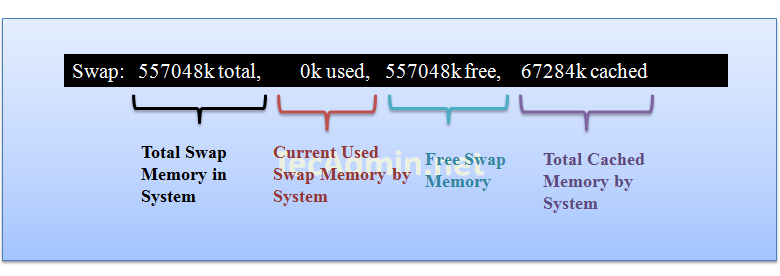
Result Row #5
Row 5 shows the swap memory utilization on the server, you can find here how much swap is being used, the same results you can find using free command.
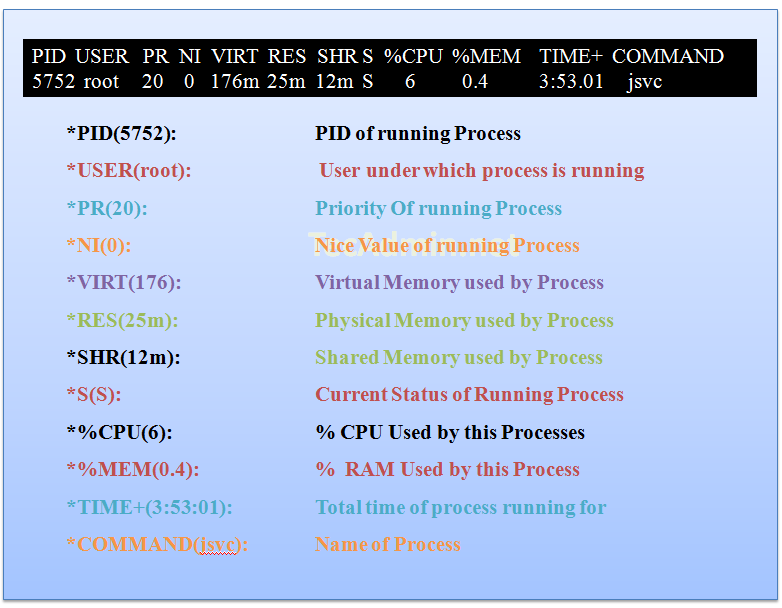
Result Row #6 ( Running Processes )
In this steps you will see all running process on servers and there additional details about them like below.
Short Results Based on Specific Fields
You can also sort the results based on the specific field. Use the following key combination to do short.
Nice information.
ReplyDeleteLinux Course in Pune